Analyzing Surface Water Runoff
In this exercise, you will create lines that illustrate the path that flowing water would take across a surface. Then, you will create a polygon that defines the catchment region and its area on the surfacThe water drop utility creates either a 2D or 3D polyline object that runs downhill on a surface from any point you select. You can specify whether the point you select is indicated with a marker. After the lines are created, you can edit or modify them as needed.
You can use the information you get from the water drop analysis to calculate catchment areas, based on specified low points of the surface. The catchment regions can be created on the surface as either 2D or 3D polygons, which can be exported to a hydrology application for detailed analysis.
This exercise uses a drawing file similar to the one used in Exercise 3: Creating a Watershed Legend. The surface style is changed to make it easier to see the basic surface features, and it contains a simple point style for you to use as a start point marker.
This exercise continues from Exercise 4: Extracting Objects from a Surface.
Perform a water drop analysis
- Open Surface-5C.dwg, which is located in the tutorials drawings folder.
- Click tab
 panel Flow Paths drop-down Find.
 - In the Water Drop dialog box, specify the following parameters.
- Path Layer: C-TOPO-WDRP
- Path Object Type: 2D Polyline
- Place Marker At Start Point: Yes
- Start Point Marker Style: WD Start
- Click OK.
- In the drawing, click several locations near those displayed in the following illustration.A 2D polyline is drawn, representing the flow of water from the spot you selected. The start point of the path is indicated by a
 marker.If a water path splits, additional lines are drawn to follow each path.
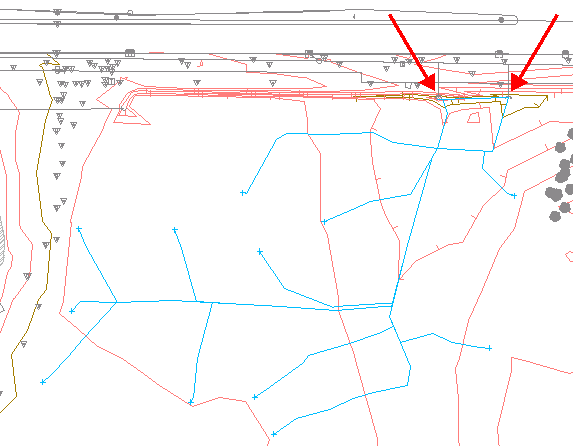
- Waterdrop paths (arrows indicate culvert inlet locations)
- Press Enter to end the waterdrop command.Notice that most waterdrop paths in this area drain to the culverts that are indicated by the red arrows. Next, you will use the water drop paths you just created to define a catchment area that influences the culverts.
Create catchment areas
- Click tab panel Catchments drop-down Find.
- In the Catchment dialog box, specify the following parameters:
- Display Discharge Point: Yes
- Discharge Point: Catchment
- Catchment Layer: C-TOPO-CATCH
- Catchment Object Type: 2D Polyline
- Click OK.
- In the drawing, click the marker for each waterdrop path.Blue polygons that define each catchment region are created. The area value of each catchment region is displayed on the command line. In the drawing, each catchment point is indicated by a
 marker.Note:If you receive a message indicating that the specified location results in a catchment area with no area, it means that there is no flat area or high spot on the specified point.
 - Press Enter to end the catchment area command
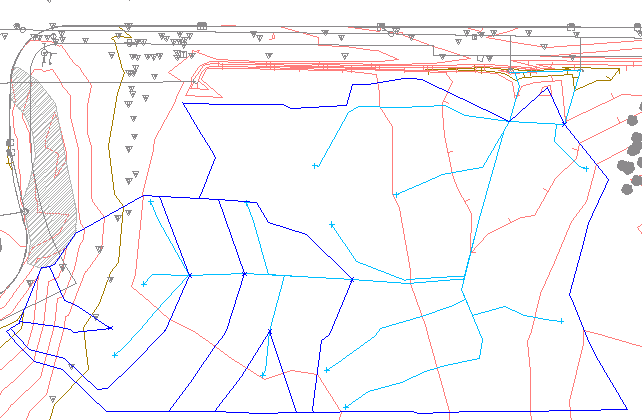
- Catchment areas defined
Combine multiple catchment areas
- In the drawing, select the polygons that define catchment areas. Right-click. Select Isolate ObjectsIsolate Selected Objects.The polygons are displayed in the drawing window, but all other objects are hidden.
- Select the polygons again.
- On the command line, enter LineWorkShrinkWrap.A polygon that contains the combined area of the catchment areas is displayed. The LineWorkShrinkWrap command creates a single outside boundary of a selection of touching polygons. The original polygons are not deleted.
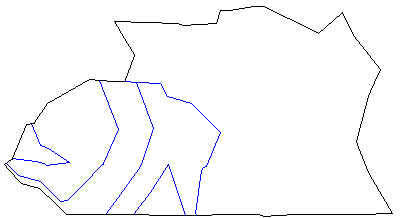
- Combined catchment areas
- In the drawing, right-click. Click Isolate ObjectsEnd Object Isolation.The remaining drawing objects are displayed in the drawing window.Tip:You can transfer individual or shrinkwrapped catchment area polygons to a hydrology application for further analysis.
posted by Digital Marketing @ December 01, 2019
0 Comments
![]()

0 Comments:
Post a Comment
Subscribe to Post Comments [Atom]
<< Home